Webinars are on the rise. Businesses run more webinars than ever, and decision makers participate in them weekly. Here are 56 key stats to help you understand the trends — and make smarter webinar decisions.
- How effective are webinars?
- What are the best days and times to host them?
- What's the best day to send your invitations?
Most webinar statistics are from the same old reports (2015-2018) — so we wanted to make our own report and include some up-to-date statistics from our 2025 data.
We'll answer all of these questions and more through these 56 researched-backed webinar statistics so you can become a webinar pro.
Contrast is a modern webinar platform designed to scale your webinar strategy, deliver branded, engaging experiences, and repurpose your content in minutes with AI.
Top 2025 Webinar Statistics
If you were to remember only a few webinar statistics, remember these:
- 91% of B2B professionals say webinars are their preferred type of content
- 75% of webinars have fewer than 50 live attendees
- 47% of webinar views are on-demand (replay)
- 60-minute webinars have the highest average registrations
- Webinars with <100 registrants have 5% higher live attendance rates
- 22% of webinar registrations happen on Thursdays
- 13% of webinar registrations happen the day of the webinar
- 87% of B2B Marketers use AI for their webinars and virtual events
- AI repurposing features save marketers over 13,000 hours and $650,000 a year.
What Makes Webinars Good for Marketing?
Your good old marketing and sales tactics just don't have the same impact as they used too. And for good reason — consumers are getting smarter about them: they can recognize an ad or a sales pitch from a mile away.
This makes webinars a particularly powerful medium for businesses.
Buyers are searching for valuable content and solutions to help them solve their problems, and businesses are turning to webinars to get their message across.
What is a Webinar?
A webinar is an online event (usually hosted by a company or business) broadcasted live at a given date and time. Most webinar tools let you create a registration page associated to your webinar, so your audience can sign up, get reminders, and receive a recording of the webinar.
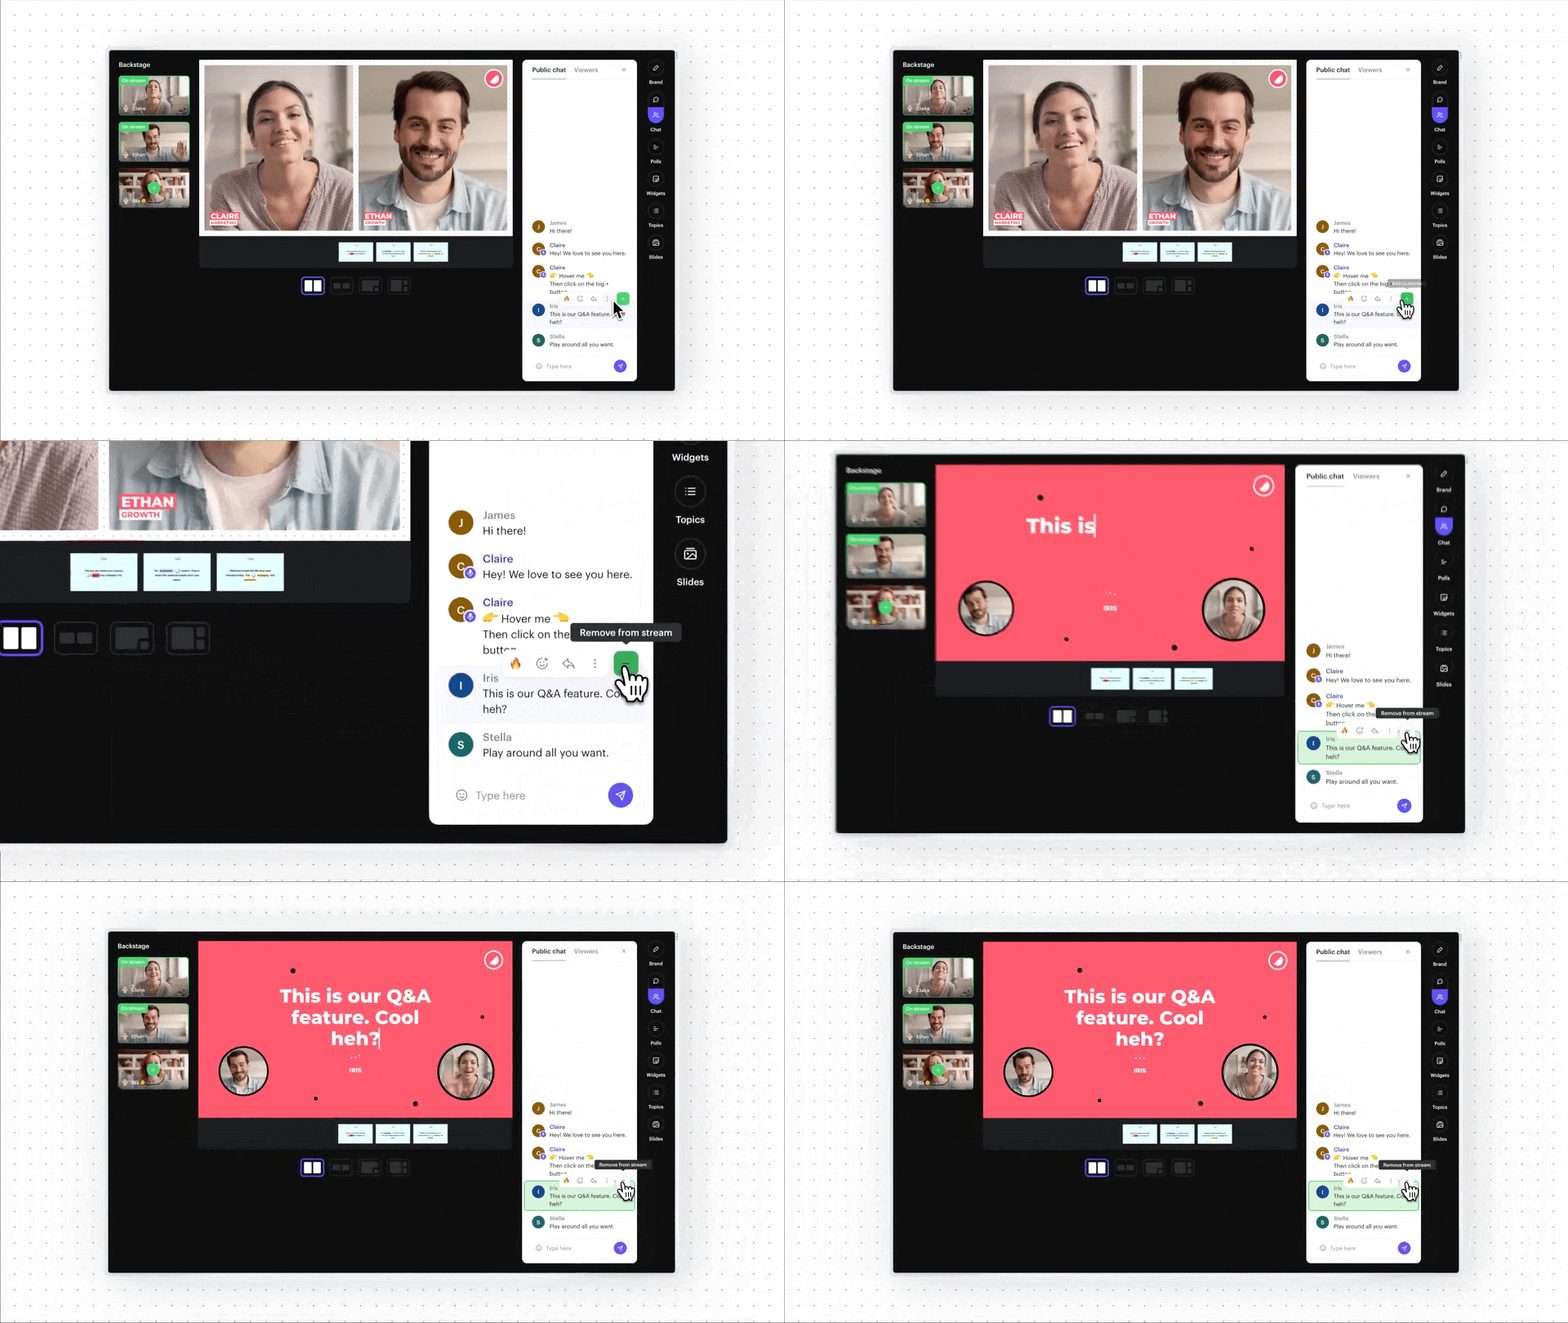
During the live event, the host (and sometimes guest speakers) will interact with the audience using engagement features like Q&A, polls, and chat.
Why Run Webinars in 2025?
We see webinars making a comeback in 2025, and for many reasons. Banner blindness, overexposure, and consumer education are making other acquisition channels less effective.
Webinars on the other hand, offer 3 main advantages:
- Lead generation: Marketers can use webinars to create and extend their email marketing audiences all while making sure that they are relevant contacts (because they are interested in the topic of the webinar). Webinars are powerful lead generation tools, both for increasing the number of leads and moving them down the funnel.
- Authenticity and engagement: Live webinars give hosts and speakers a platform to share their stories and experiences, which humanizes the brand. Audience members get the opportunity to engage with the brand, increasing stickiness and likelihood to buy.
- Repurposing: Marketers are often asked to "do more with less" in tough economic periods — and webinars are a great solution to this. Repurposing webinar content is a great way to increase content output: each webinar can become a blog article, a few social media posts, and short highlight clips.
If you're ready to implement these strategies, our complete webinar guide walks you through every step of the process.
Are Webinars Worth it in 2025?
Webinars are one of the most effective content formats for businesses in 2025—and the data proves it.
Let’s dive into the numbers that show just how powerful webinars have become.
1. B2B marketers rank webinars as the #2 best-performing content format
(Content Marketing Institute — 2023)
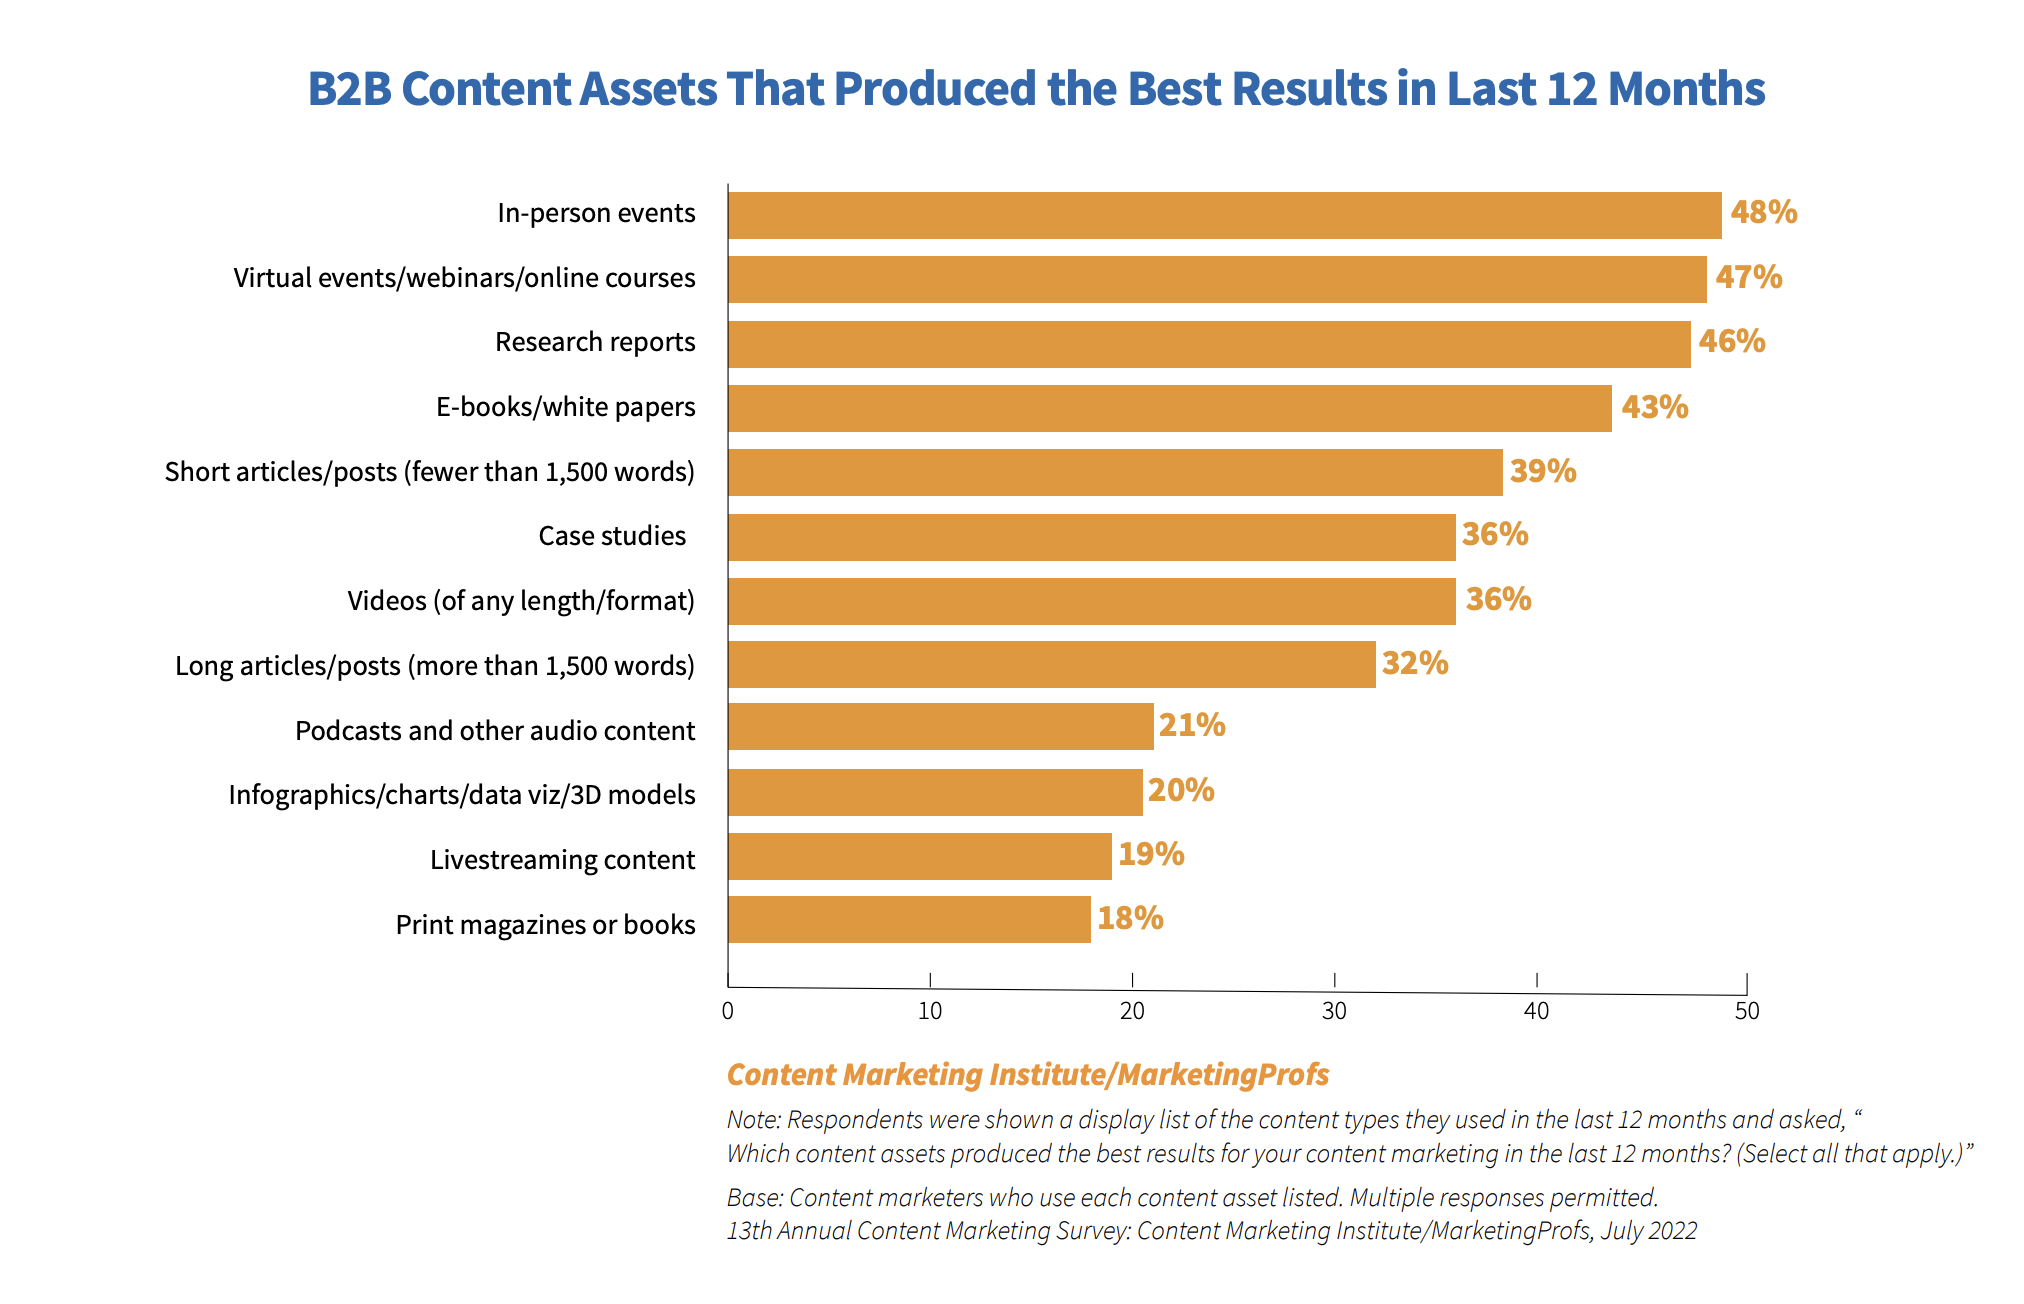
64% of B2B marketers hosted a webinar in the past 12 months, putting it in the top 5 most-created content formats. And 47% of B2B marketers said that webinars (or virtual events/online courses) were the best performing content format they had produced in the past 12 months.
2. B2B marketers consider webinar lead quality to be “above average”
(ON24 — 2020)
68% of surveyed marketers could tie webinars to revenue. 75% of them said webinars lowered their cost-per-lead. 38% rated webinars leads a 4 or 5 on a five-star scale, and the average rating was a 3.3/5.
3. 67% of professionals want "Tips, tricks, and best practices" content
(BrightTALK — 2021)
The category was voted "most valuable for professional growth" followed by course (53%), case studies (53%), and industry trends (50%).
General Webinar Statistics
Let's cover some high-level statistics about the webinar market:
4. The global webinar and virtual event market will hit $1 trillion by 2032
(Custom Market Insights — 2023)
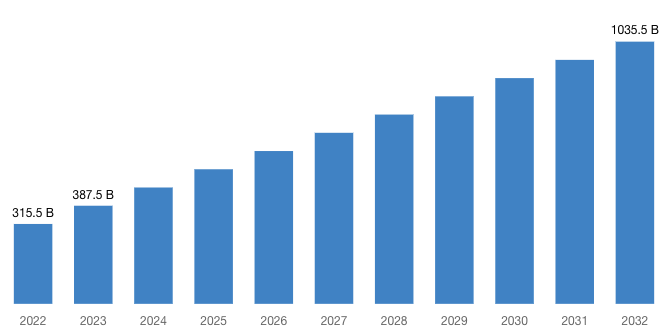
The virtual events industry is absolutely exploding right now. The market was worth around $315.5 billion in 2022 and is expected to hit over $1 trillion by 2032 – that's a 14% growth rate year over year.
What's really interesting is that this isn't just leftover momentum from the pandemic. Companies have discovered that virtual events work incredibly well for reaching global audiences without the massive costs and logistical headaches of traditional events. People can join from anywhere, businesses save on venue and travel expenses, and you get better engagement data.
5. 77% of webinar revenue comes from North America
(Research Nester)
America dominates the webinar scene bringing in over 3/4 of the total revenue. However, Europe, Africa, and the Middle East are fast-growing regions in this market.
6. 58% of B2B marketers use webinars as a promotional tool
(Content Marketing Institute – 2023)
Webinars are actually converting prospects into qualified leads at a much higher rate than other marketing channels. When you can showcase your expertise, demonstrate your product, and interact directly with potential customers all in one session, it makes sense that webinars have become such an effective lead generation machine.
7. Standalone webinars generate 56% more registrations than webinar series
(Contrast – 2025)
Asking someone to sign up for a single event feels much more manageable than committing to multiple sessions. Standalone webinars also create urgency since there's no "I'll catch the next one" mentality.
8. Over 75% of webinars have fewer than 50 live attendees
(Contrast — 2025)
Most webinars don't have thousands of people attending — and that's ok. As we'll see later, smaller webinars have higher live attendance rates and average engagement. But only 69% of webinars have under 50 views (live + on-demand).
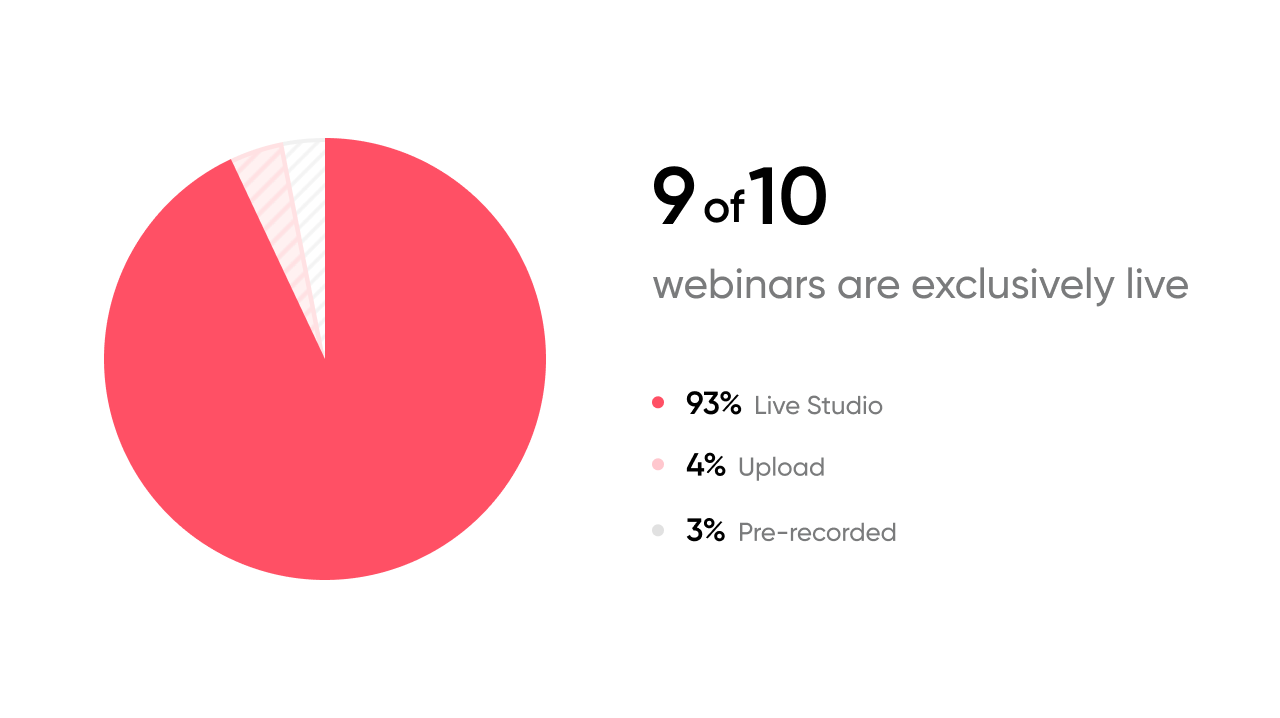
9. 93% of webinars are delivered live
(Contrast — 2025)
This shows that webinar hosts strongly prefer live formats because they can interact directly with their audience, answer questions immediately, and create a more engaging experience.
Only about 3% of webinars are simulive, where the entire session is pre-recorded and presented as if it’s happening live. Meanwhile, around 4% of webinars incorporate short pre-recorded videos during the live session — typically demo clips or related content — while the majority of the webinar remains live.
Webinar Registration Statistics
What are the days of the week with the most registrants? How long should your webinar be? What prevents people from registering to your webinars?
Let’s explore the key data points that reveal how to maximize your webinar registrations.
10. People register for 2 webinars on average
(Contrast — 2025)
On average, each person registers for about 2 webinars per year. This shows that attendees are interested enough to come back for more than just one session, making webinars an ongoing part of their learning or engagement.
11. People watch 2 webinars on average
(Contrast — 2025)
Over the last year, people watched an average of 2 webinar sessions on Contrast—the same number they registered for. This shows that when webinars deliver quality, engaging content, audiences stay committed and keep coming back.
12. Webinar registration page conversion rate can be up to 59%
(Contrast — 2025)
Webinar registration page conversion rates can reach up to 59% with Contrast (2025). That’s nearly double the average reported by Livestorm — just 30%. While results depend heavily on traffic quality, Contrast pages consistently outperform.
The quality of your webinar registration page can have an impact on the total number of people who register and their conversion rates to live attendees. Webinar landing pages have substantially higher average conversion rates than your typical landing page (10%).
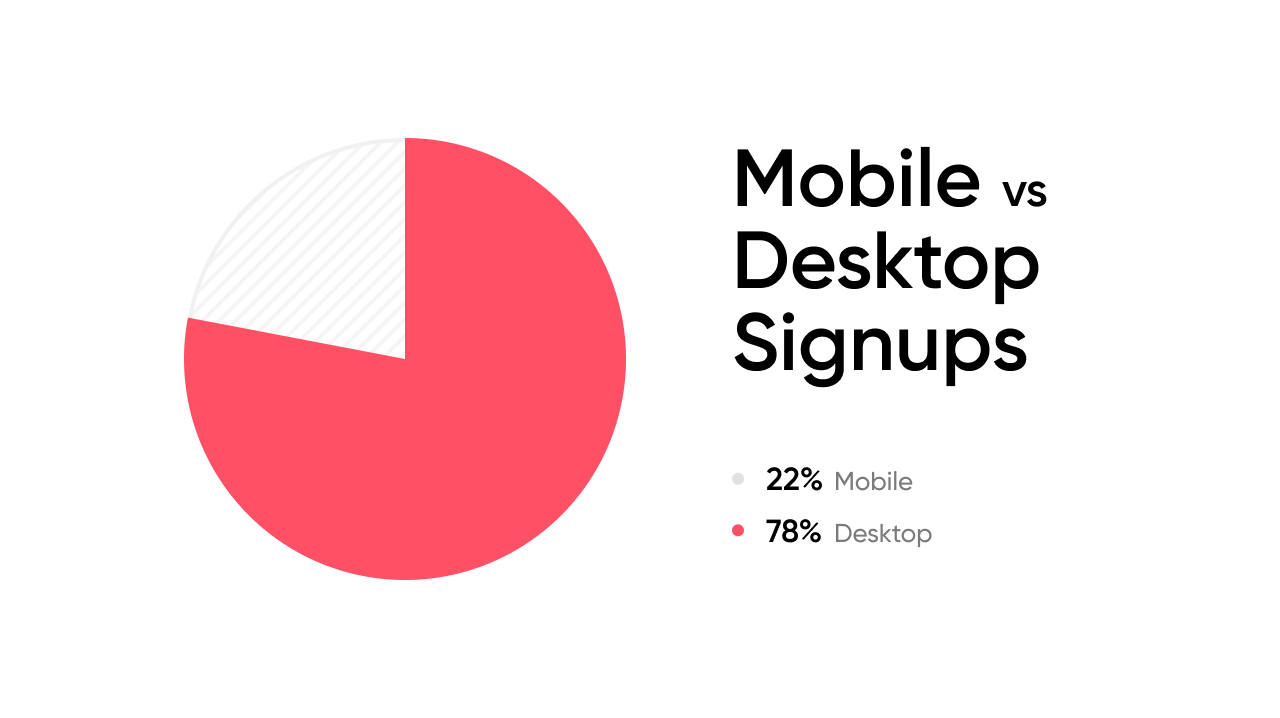
13. 78% of webinar registrations come from desktop
(Contrast — 2025)
Even though most people sign up on desktop, 22% are registering through their phones. That’s a big enough chunk to make sure your registration page works well on both mobile and desktop. A simple, fast, and mobile-friendly design can help boost sign-ups and keep the process smooth for everyone.
14. 77% of webinar signups happen via email
(Contrast — 2025)
Most people prefer using email to register for webinars, with 77% choosing it over SSO, which only accounts for 23%.
The 77% email preference likely comes down to simple user interface and habit. When people see a registration form, they automatically default to the familiar "enter your email" field rather than looking for or clicking an SSO button. It's also possible that many users are on devices/browsers where they're not already logged into their work accounts (most of the webinars require work emails).
15. 71% of webinar hosts use the built-in signup page
(Contrast — 2025)
Most webinar platforms let you choose between using their built-in signup pages or connecting an external form, like HubSpot. You should look for a tool that integrates seamlessly with your CRM — especially if you’re using HubSpot — so you can avoid manual CSV uploads and keep your workflows flowing effortlessly.
16. Thursday webinars have the highest average registrations
(Contrast — 2025)
The stats show that Thursdays are probably the best day to run your webinar. Thursday webinars have on average 30% more registrants. This makes a lot of sense when you think about people's weekly rhythms – by Thursday, they've settled into their work week, handled Monday's chaos, and aren't yet mentally checked out for the weekend like they might be on Friday.
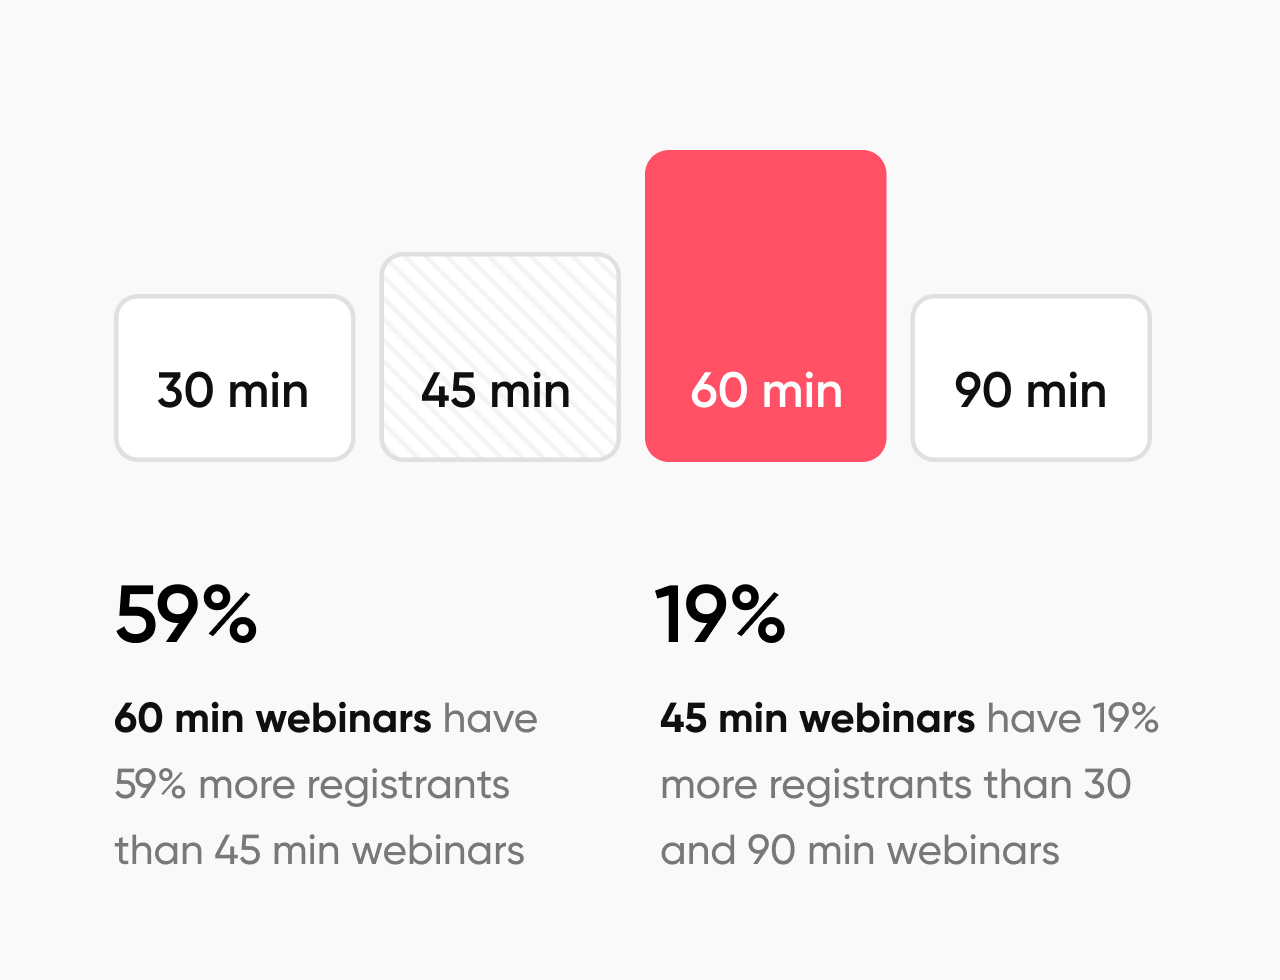
17. 60-minute webinars have the highest average registrations
(Contrast — 2025)
While 90-minute webinars achieve the highest live attendance rates, 60-minute webinars dominate when it comes to registrations, followed by 45-minute, 30-minute, and 90-minute sessions respectively.
18. 78% of people would not register to a webinar that looks too "salesy" or marketing-focused
(BrightTALK — 2021)
Other common reasons for not wanting to register to a webinar are: content is too product-focused (78%), or poor platform experience (78%). Make sure your content is aligned with your audience and you're using a modern webinar platform.
19. Email marketing is the best channel for registrations, ads are the worst
(Contrast – 2025 External Survey)
We did an external survey of 227 B2B SaaS marketers to find out which channels they use to promote their webinars and which drive the highest-quality leads.
Here are the results: 94% use social media posts, 86% marketing emails, 56% newsletters, 46% website banners, 38% LinkedIn DMs and 25% communities to promote their webinars. However, when asked which channels drive the most high-quality leads, marketing emails dominated with 91% of respondents naming them as their top-performing channel, while newsletters (20%), website banners (18%), LinkedIn DMs (16%), and paid ads and communities (11%) were mentioned considerably less often.
This shows that although social media is widely used for reach, email marketing remains the clear winner for attracting qualified webinar attendees who are more likely to convert.
20. Webinars with guest speakers drive more registrations
(Contrast – 2025 External Survey)
Guest speakers appear to be a significant factor in webinar success.
Almost half of marketers (45%) invite a guest speaker to every webinar, and 21% do it often but not for all webinars. That means most webinars feature voices outside their own company.
34% of webinars feature only internal speakers, which often comes across as too scripted or overly sales-focused. When it's just company voices, audiences quickly lose patience with "us talking about us" narratives.
On the other hand, webinars with guest speakers get 3 times more engagement. That’s because outside experts bring fresh ideas, credibility, and real conversations that audiences want to hear. Plus, guest speakers help you tap into their networks, expanding your reach beyond your existing audience.
Webinar Engagement Statistics
Now lets look at the viewer engagement statistics that you can use to improve your webinar strategy:
21. 62% of registrants watch the webinar (live or replay)
(Contrast — 2025)
On average, nearly 6 out of 10 registrants watch Contrast webinars. Frictionless user experiences, automated reminders and follow-ups, automatic on-demand webinars and AI repurposing features all increase content consumption.

Want to Run Better Webinars?
Get a personalized demo and see how Contrast can elevate your webinars
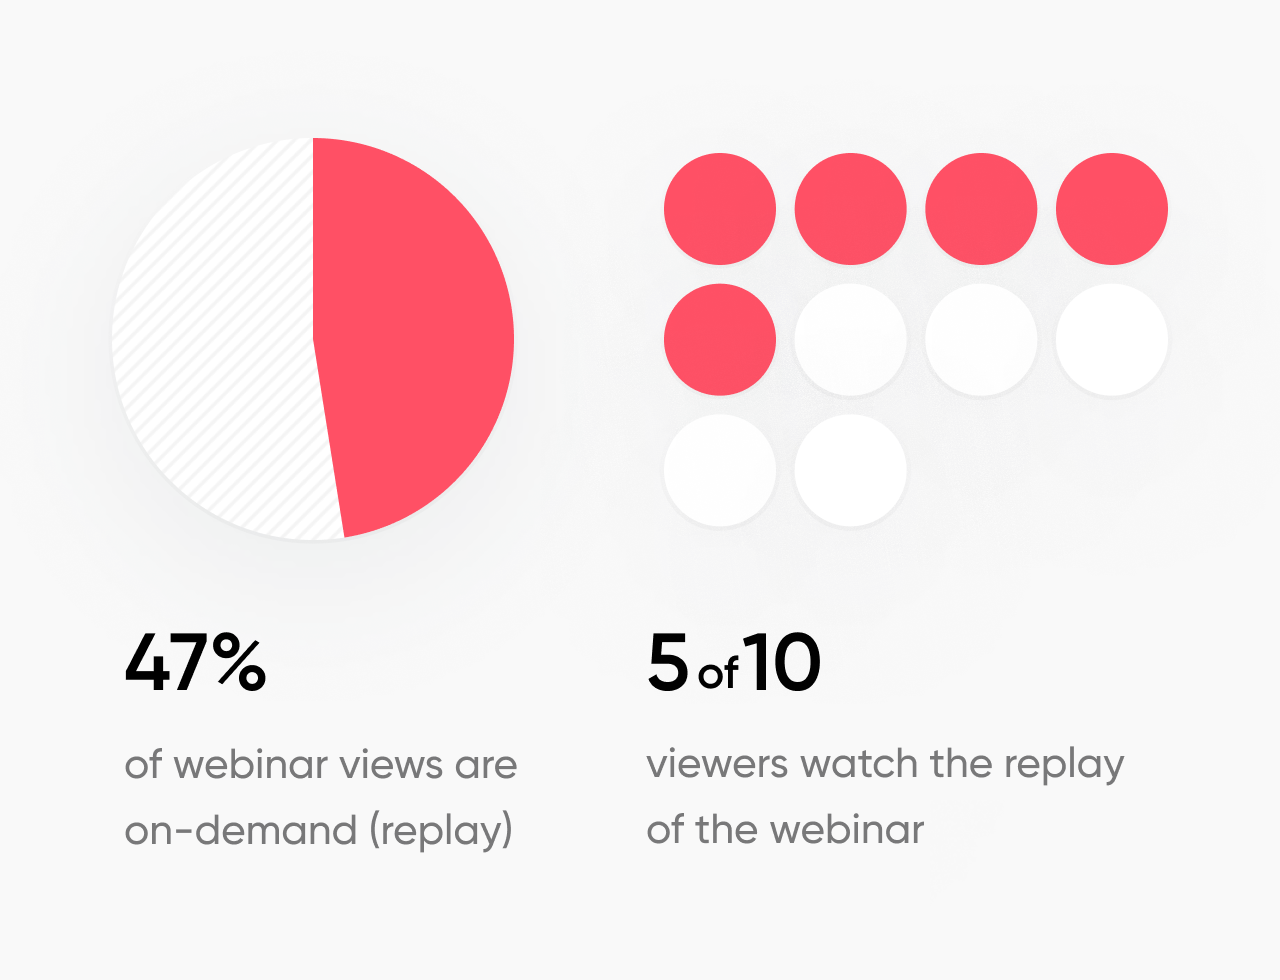
Book your demo22. 47% of webinar views are on-demand (replay)
(Contrast — 2025)
Most people have busy schedules and won't be able to make it to the live. On average, 47% of registrants watch the replay.
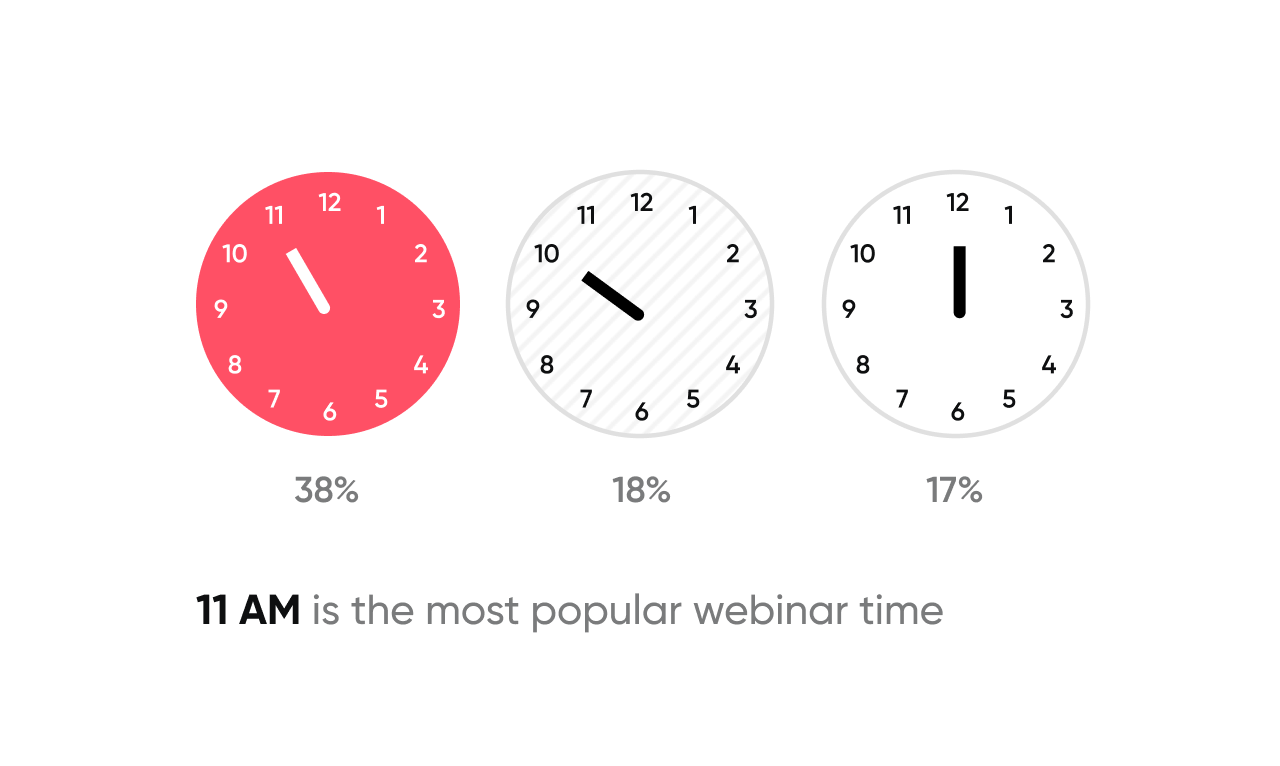
23. 38% of webinars happen at 11AM local time
(Contrast — 2025)
Most webinars happen at 11AM local time, followed by 10AM (18%) and 12PM (17%). Not surprisingly, these webinar slots also have above-average live attendance rates. This is a significant increase from last year, when only 17% of webinars were held at 11AM.
24. 44% of webinars use live polls
(Contrast — 2025)
Polls are a great way to interact with your audience but only 44% of webinar hosts use live polls to engage their audience – though this number has increased by 14% from last year.
25. The average number of poll responses is 24
(Contrast — 2025)
Polls are a great way to learn more about your audience, but also to qualify them. Those 24 responses represent your most engaged attendees, the ones who are invested in your content and willing to interact.
26. The top 5% of webinars get 52% poll completion rate
(Contrast — 2025)
The best webinar hosts run a poll every half an hour (30 mins). Which for a 1h webinar is 2 polls on average. People complete them 52% of the time. Hosts that show polls on-stage get 15% more completions than hosts who don't.

27. 92% of webinar attendees say the end of your event must include a live Q&A session.
(Truelist – 2024)
This statistic really highlights how audiences have moved beyond passive consumption – they want to engage, ask questions, and get real-time responses from presenters. It makes perfect sense when you think about it: after sitting through a presentation, people naturally have questions or want clarification on specific points.

The Best Webinar Experience for your Viewers
Start for free with up to 30 registrants. No credit card needed.
Start for freeWebinar Attendance Rates
Increasing your webinar attendance rates is an easy way to increase your webinar ROI — so whats the best way to do so?
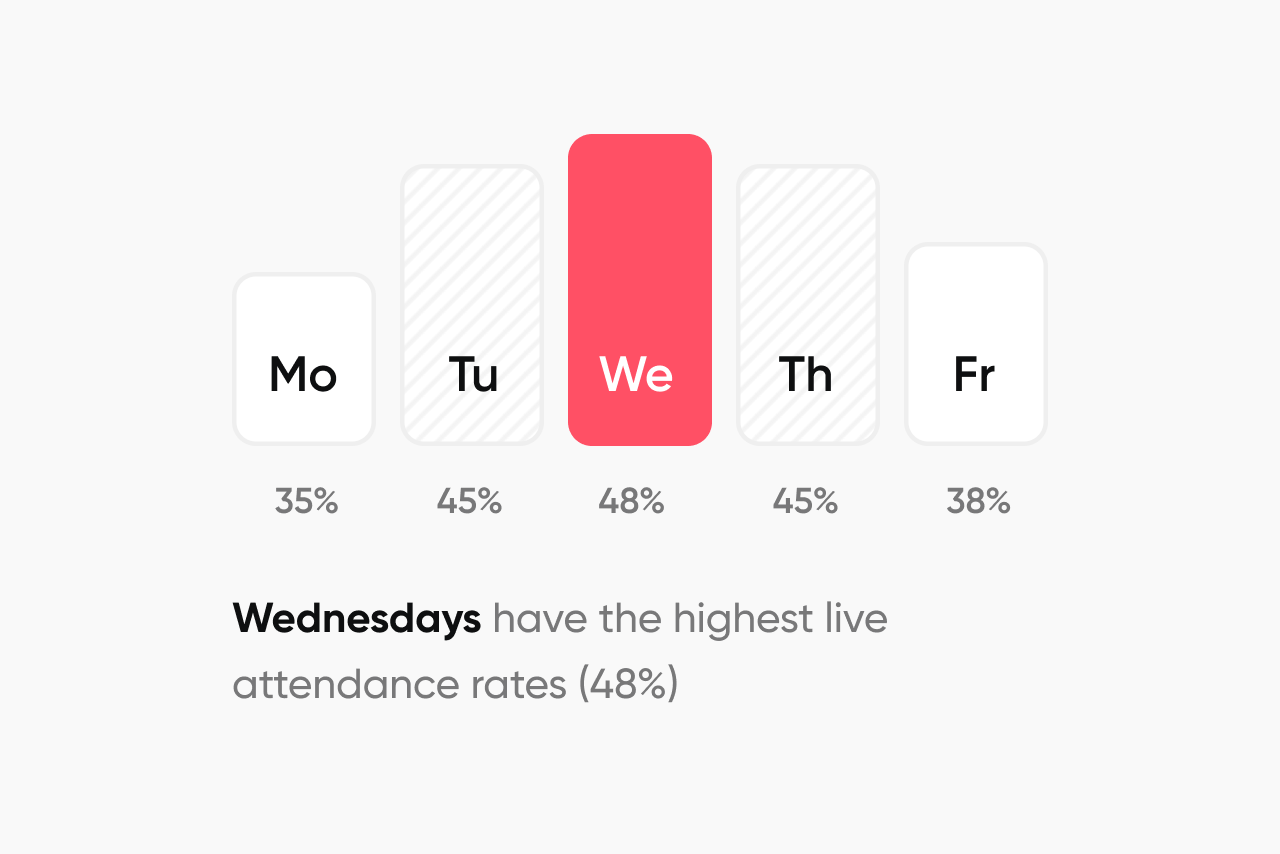
28. Wednesdays have the highest live attendance rates (48%)
(Contrast — 2025)
Want to maximize the number of people who make it to your webinar live? Host your webinar on a Wednesday. Thursday and Tuesday are the second and third-best days to host your webinar, with 45% live attendance rates.
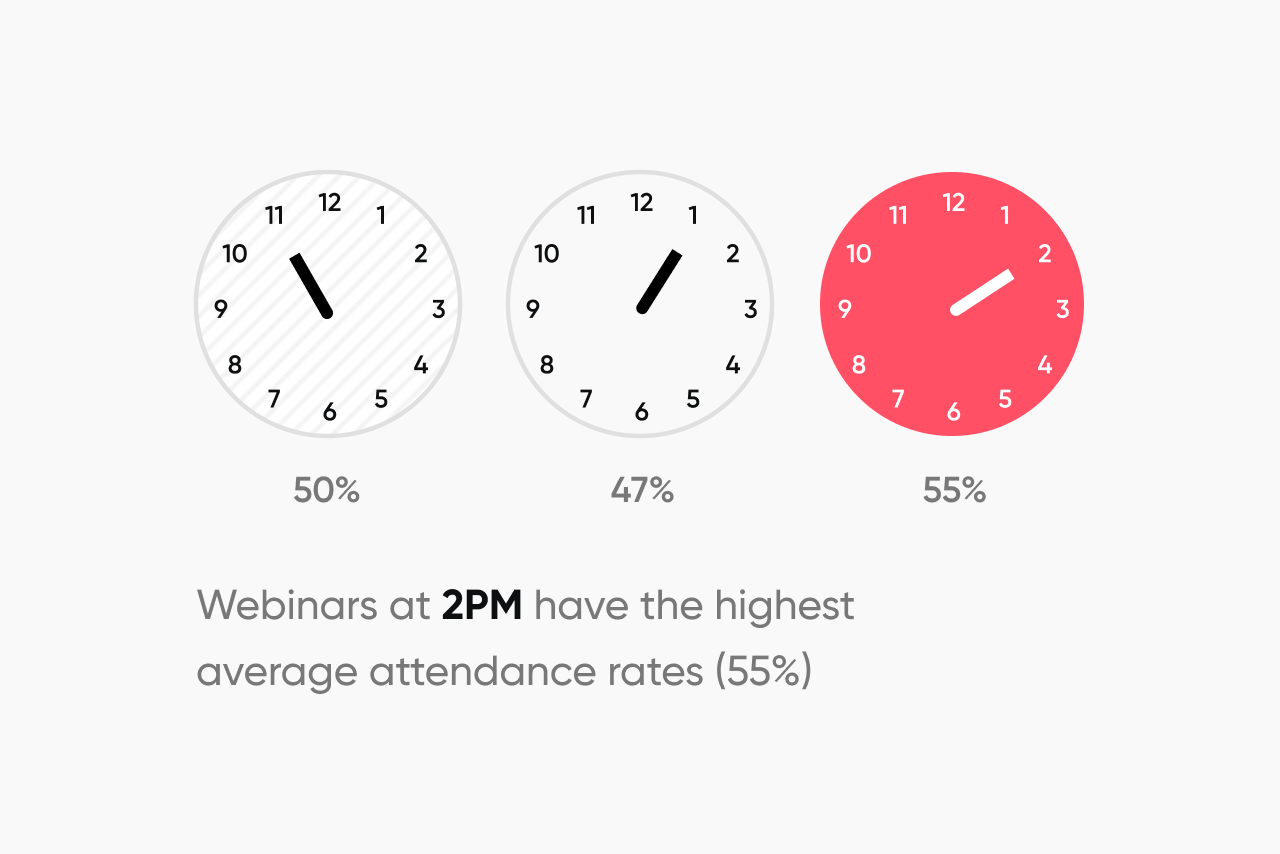
29. Webinars at 2PM have the highest average attendance rates (55%)
(Contrast — 2025)
The timing sweet spot for webinars is 2PM at 55%, followed closely by 11AM at 50%. Most 2PM webinars are scheduled in CET, which translates to 8AM EST, giving American audiences a chance to join during their morning hours.
Conversely, 11AM EST webinars work perfectly for European participants who can attend at 5PM CET, right at the end of their workday.
It's smart scheduling that maximizes global participation by finding those timezone sweet spots that work reasonably well for both major business markets.
30. January is the month with the highest average live attendance rate (50%)
(Contrast — 2025)
January is the top month for webinar attendance, with live attendance rates reaching 50% - the highest of any month, followed by February at 48% and October at 47%.
A lot of companies wait for the new year to run webinars and make their announcements. This webinar attendance peak also aligns with New Year professional development goals, as January represents when people are most motivated to learn and invest in career growth.
31. 90-minute webinars have 29% higher live attendance rates than 30-minute webinars
(Contrast — 2025)
Webinar duration significantly impacts live attendance rates, with 90-minute webinars achieving the highest attendance at 72%. This is followed by 45-minute webinars at 47%, 60-minute sessions at 46%, and 30-minute webinars at 43%. When people sign up for 90-minute webinars, they’re more likely to show up and stick around. It shows that if someone commits to a longer session, they’re probably really interested in the topic.
32. The average completion rate for a 60-minute webinar is 40%
(Contrast — 2025)
On average, 40% of viewers stay for the entire 60-minute webinar. That means while many are engaged, a good number drop off before it’s over. This shows how important it is to keep things interesting throughout. Adding polls, Q&A sessions, or interactive moments can help hold attention and keep people watching until the end.
33. Webinars with <100 registrants have 5% higher live attendance rates
(Contrast — 2025)
Smaller webinars tend to be more targeted and relevant to the audiences. This increases live attendance rates. They also get 10% more total views. Running more, smaller webinars can be a great way to increase webinar engagement.
1000+ registrant webinars have the lowest average attendance rates at 41%, while those with 100-1000 registrations perform slightly better at 43%.
34. 82% watch webinars on desktop, 18% on mobile
(Contrast — 2025)
We already talked about how important it is to optimize your registration page for both mobile and desktop, especially since 78% of registrations come from desktop and 22% from mobile. The same goes for the viewing experience.
While 82% of attendees watch webinars on desktop, 18% still tune in from their phones. That’s nearly 1 in 5 viewers—and out of 500,000 registrants that we analyzed, that’s a significant number. So even though desktop is the primary screen, making sure your webinar platform works smoothly on mobile is just as important for reaching your full audience.


Zefort boosted event attendance by 79%
See what drove the numbers — and how to replicate it
Learn moreWebinar ROI: What Actually Drives Results
Based on survey data from 227 B2B marketers actively running webinars, we analyzed the metrics and content strategies that separate high-performing programs from the rest. Here is what others are measuring for ROI and which content formats are delivering the best results.
35. Educational sessions generate 53% more ROI than product demo webinars
(Contrast – 2025 External Survey)
While thought leadership webinars are the most popular format (85% of marketers run TL webinars), educational sessions deliver the highest ROI.
Value-driven content consistently outperforms sales-focused presentations. Educational sessions work because attendees leave with immediately applicable knowledge, creating natural progression from learning to buying.
36. Customer story webinars rank second in ROI effectiveness
(Contrast – 2025 External Survey)
Customer story webinars also deliver high ROI, ranking second among all webinar formats despite being run far less frequently than other formats (only 18% of marketers run customer story webinars).
That’s a huge missed opportunity. These sessions work so well because they show your product in action through real customers, giving prospects both proof and relatable stories at the same time. People trust people, and when they see someone like them winning with your product, it makes buying feel like the obvious next step.
37. 35% of marketers reported their biggest challenge is proving ROI to stakeholders
(Contrast – 2025 External Survey)
We all face challenges when running webinars. Out of 227 marketers 38% reported their biggest struggle is promoting the webinar. Proving ROI to stakeholders comes next, mentioned by 35%, and that often happens because their webinar data isn’t properly integrated with their CRM. Without that connection, it’s hard to show real pipeline impact.
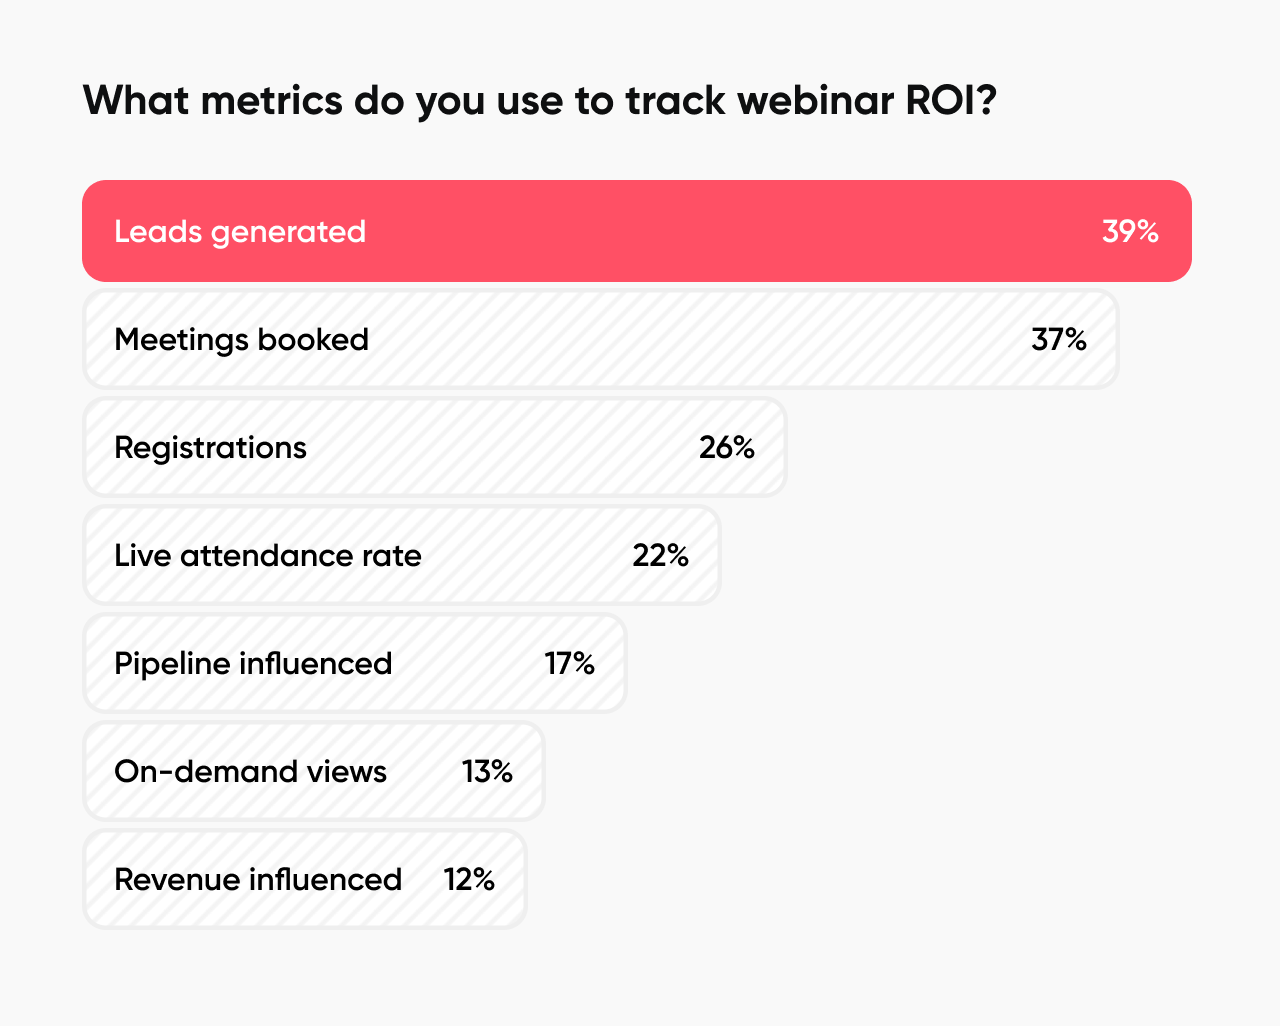
38. 39% of marketers track leads as their primary webinar metric
(Contrast – 2025 External Survey)
Almost 40% of marketers track leads generated as their main webinar metric because leads offer immediate, easy-to-measure results. However, only 17% track how webinars influence pipeline, and just 12% measure their actual impact on revenue. This gap in deeper measurement helps explain why “proving ROI to stakeholders” is the second biggest challenge marketers face.
Webinar Marketing Statistics
These webinar statistics will help you improve your webinar promotion efforts:
39. Marketers host a webinar every 19 days
(Contrast — 2025)
Companies typically host webinars every 19 days, which works well for keeping audiences engaged without overwhelming them. This cadence shows that most organizations use webinars as part of their ongoing marketing and education efforts, not just as occasional events.
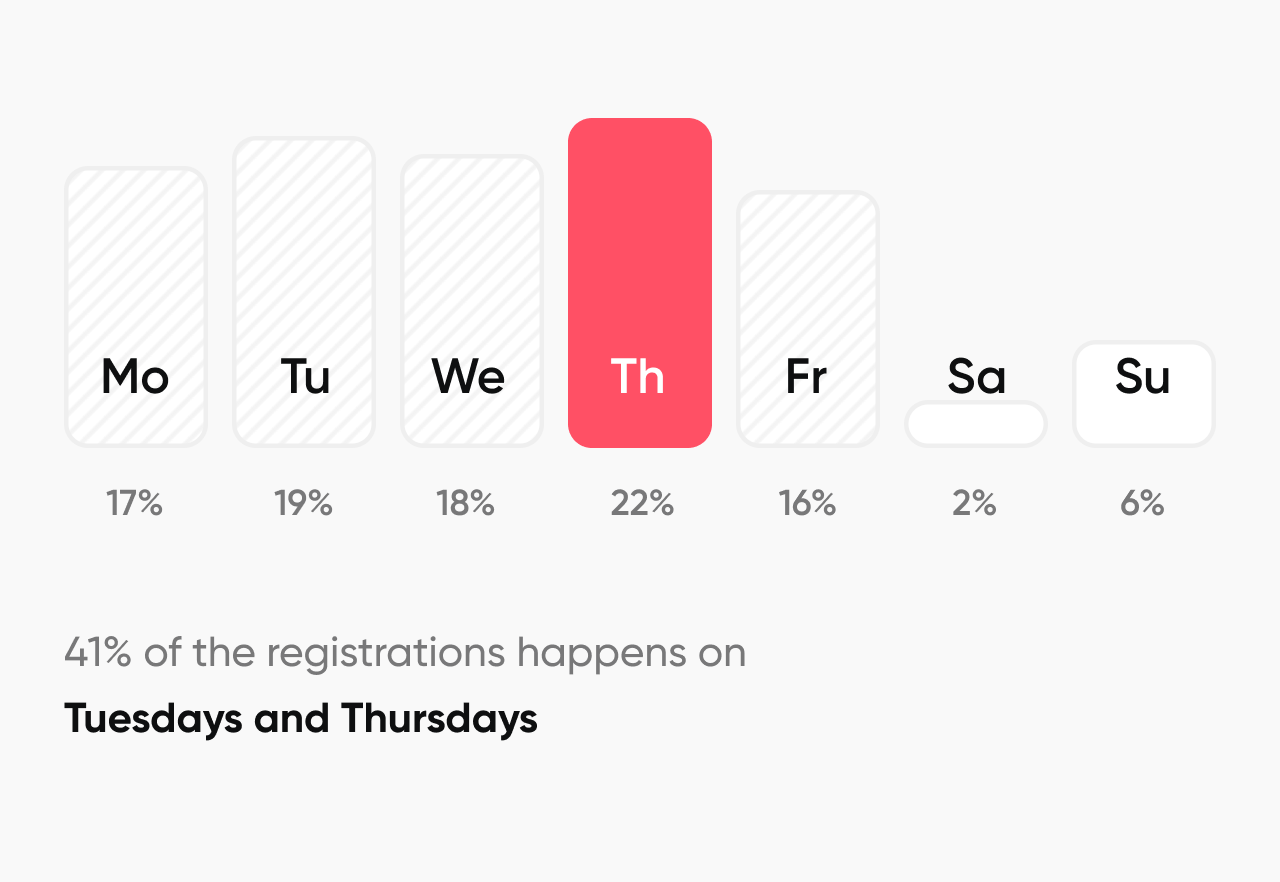
40. Most registrations happen on Thursdays (22%)
(Contrast — 2025)
Thursday is the day of the week with the most registrations, followed by Tuesday (19%) and Wednesday (18%). These are the best days to send out invitations to your webinar.
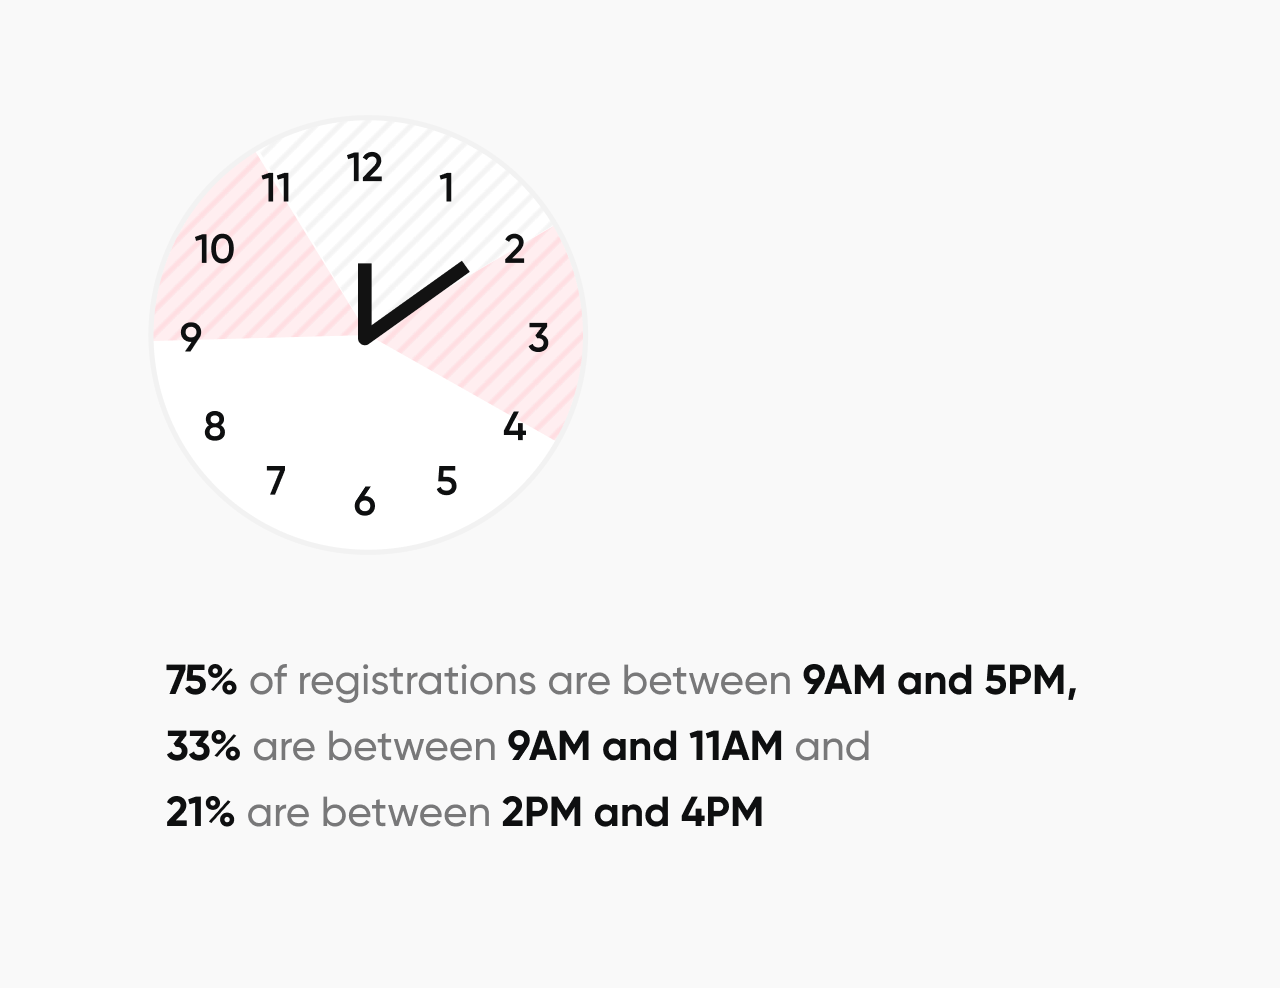
41. Market your webinar between 9AM and 5PM local times
(Contrast — 2025)
75% of registrations happen between 9AM and 5PM local times. 33% of registrations are between 9AM and 11AM and 21% of registrations between 2PM and 4PM.
42. 48% of webinar registrations happen <7 days before the event
(Contrast — 2025)
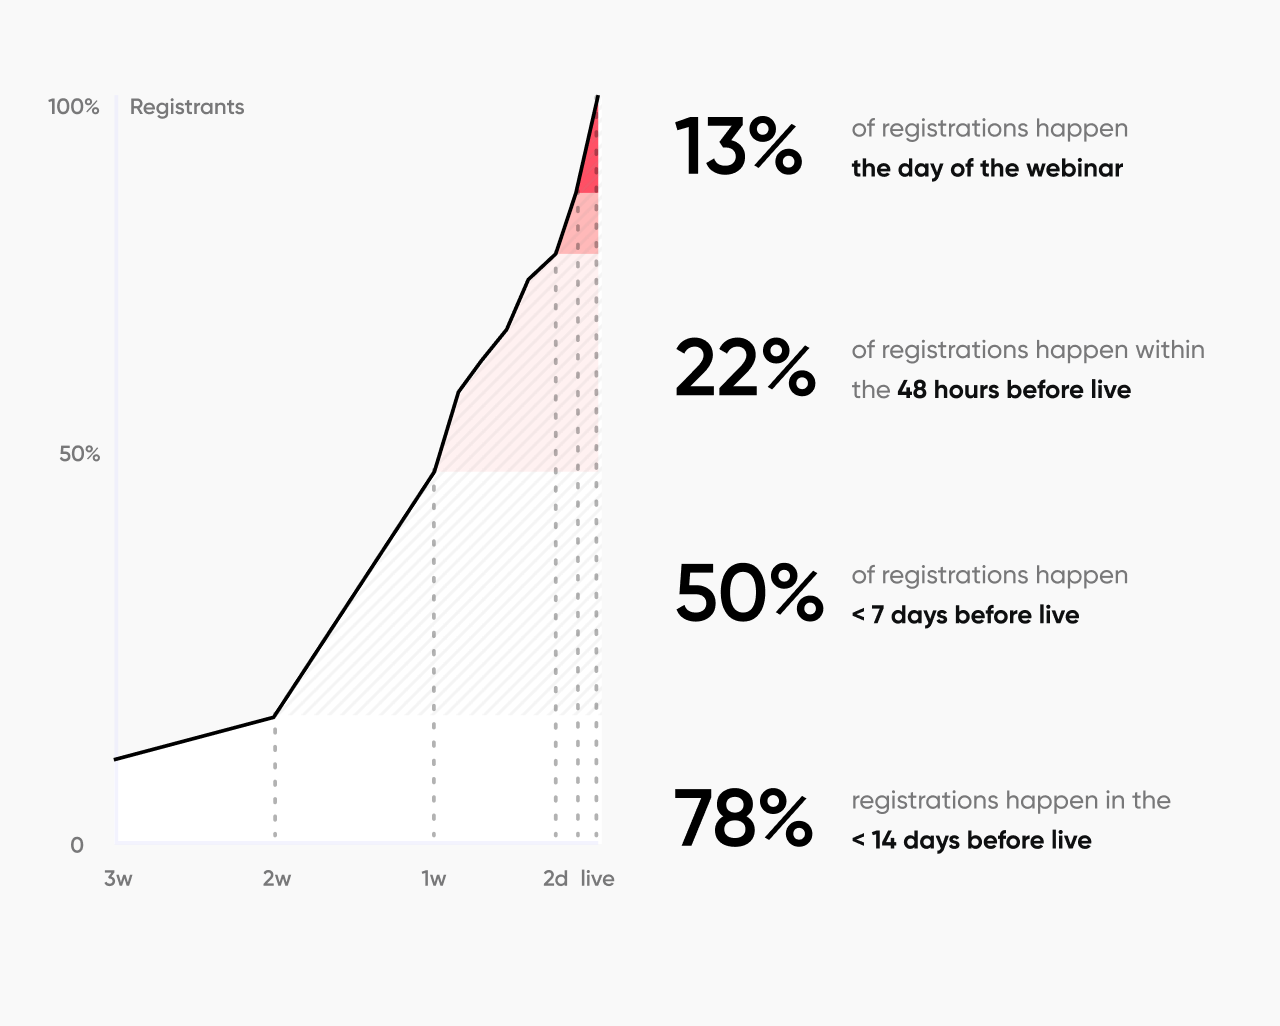
Almost half of all webinar registrations happen in the week before the webinar goes live. 77% of registrations happen in the 2 weeks before the event goes live.
Only 3% of registration happen more than 4 weeks before the webinar's scheduled date.
43. 13% of webinar registrations happen the day of the webinar
(Contrast — 2025)
Don't stop marketing your webinar until you go live, people will sign up until the last few minutes. 22% of registrations happen within the 48 hours before the webinar goes live.
44. 50% of marketers start webinar promotion more than 4 weeks in advance
(Contrast – 2025 External Survey)
Most marketers plan their webinar promotion well ahead of time, with half starting more than 4 weeks before the event and 48% beginning 2 to 3 weeks prior. Only a small number (2%) wait until the final week to begin promoting. This early start is important for building awareness and giving people time to plan to attend.
45. 57% of webinar hosts are using UTM parameters to track their webinar marketing campaigns
(Contrast — 2025)
This shows that marketers are getting smarter about attribution and measuring what actually drives registrations. UTM tracking for webinars allows you to see exactly which channels, campaigns, and content pieces are bringing in your best attendees.
46. Only 17% of marketers still use the word "webinar" in their event titles
(Contrast — 2025)
This makes complete sense from a marketing psychology perspective - "webinar" has become somewhat stale and corporate-sounding, potentially turning off audiences who associate it with dry, sales-heavy presentations.
83% of marketers are instead opting for more engaging language like "masterclass," "workshop," "live training," "demo," or "virtual event" to make their sessions sound more valuable and interactive.
47. 90% of marketers apply custom branding to their webinars
(Contrast — 2025)
Webinars are often a prospect's first real interaction with your company, so maintaining consistent visual identity through logos, colors, and branded templates creates a professional impression and reinforces brand recognition.

48. 75% of marketers integrate webinar data with their CRM
(Contrast — 2025)
Making the most of webinar data requires integrating this data with their CRM (or other systems). Common integrations are with HubSpot, Salesforce or automation tools like Zapier, Make, or Webhooks or APIs.
49. Webinar hosts send an average of 2 reminder emails
(Contrast — 2025)
Most webinar hosts send exactly 2 reminder emails to registered attendees before the event, but surprisingly, only 31% of companies send more than one reminder—meaning many registrants simply forget they signed up.
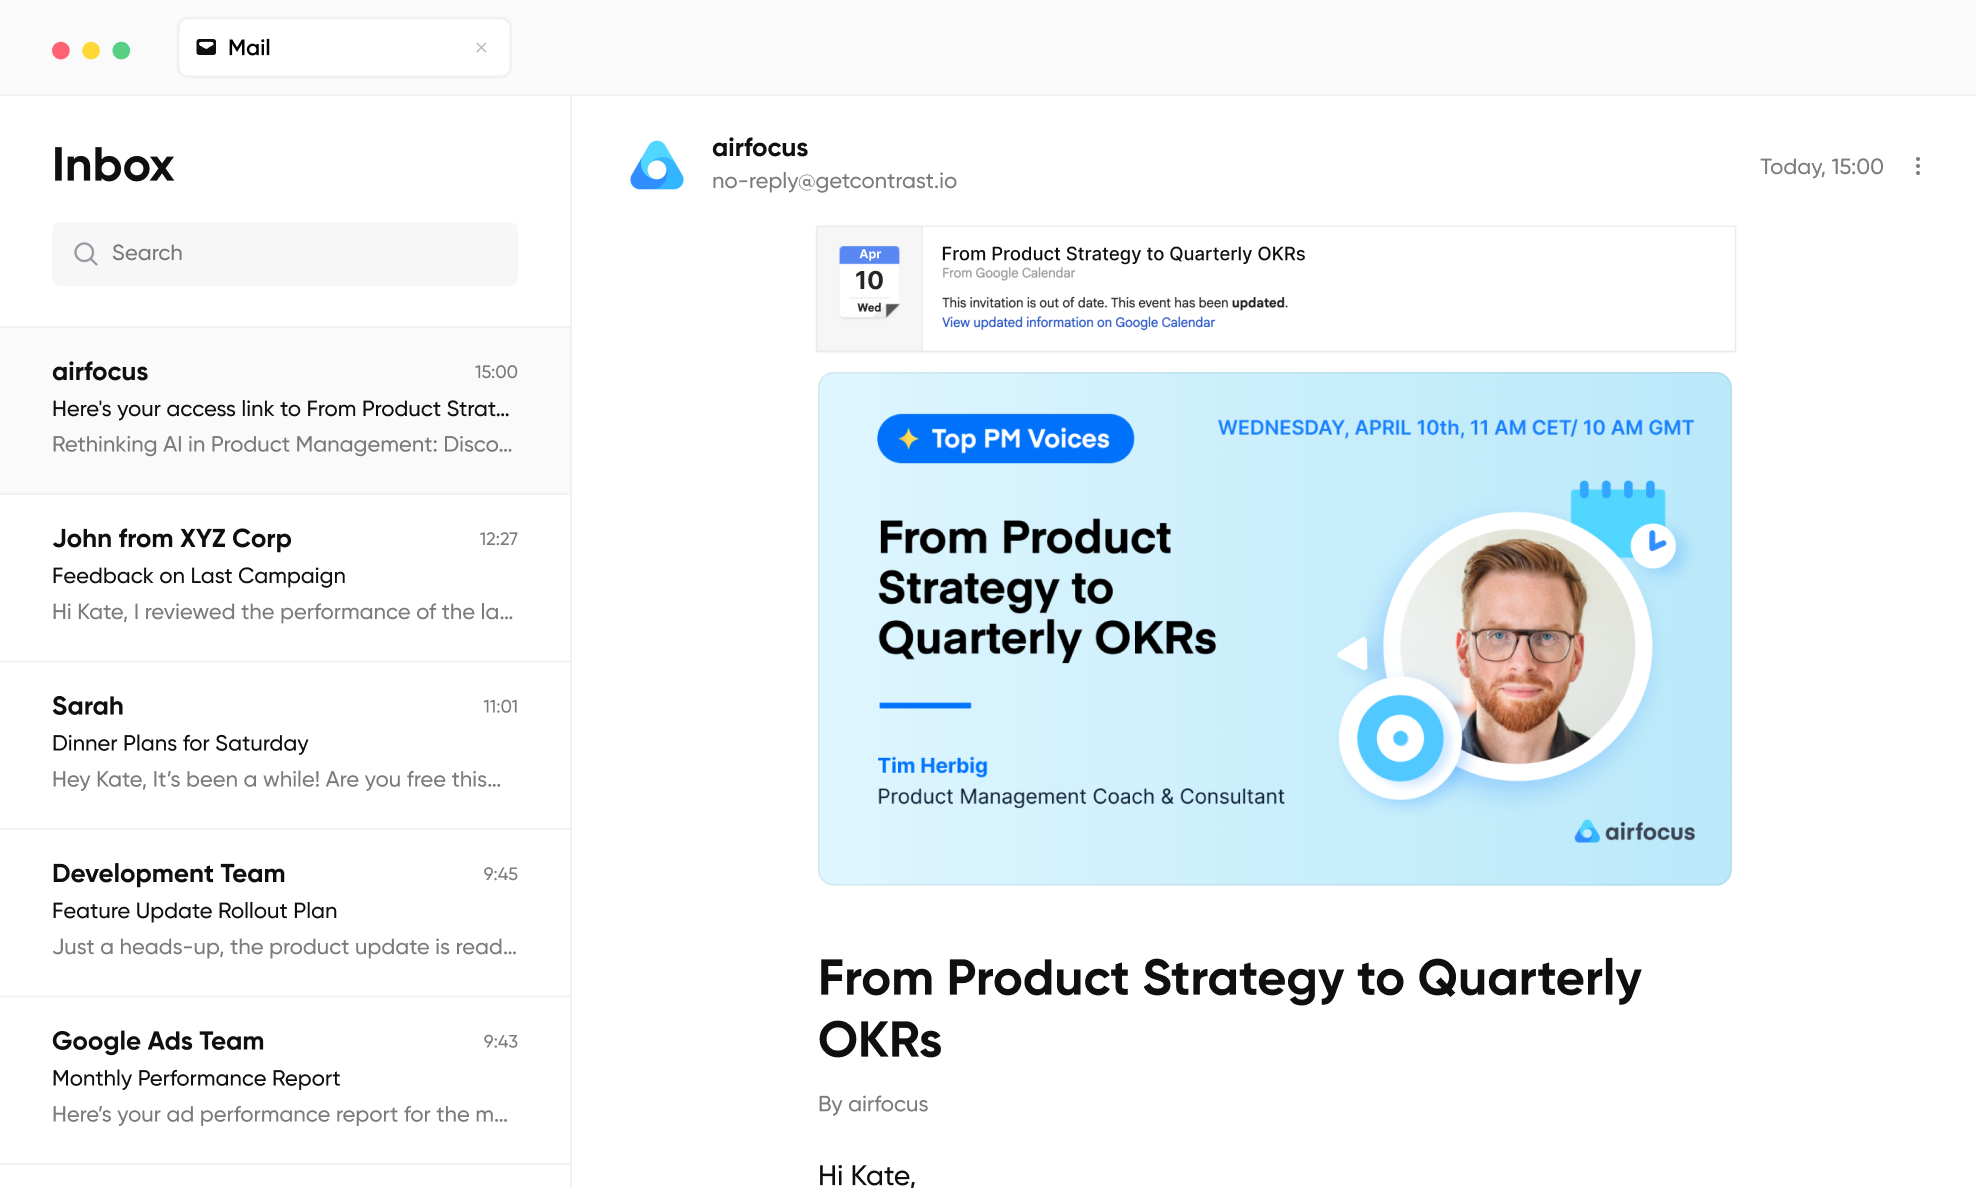
Top performers who implement a three-step reminder sequence (day before, 1 hour before, 5 minutes before) see 27% higher live attendance rates. This isn't spamming—it's helping people show up for something they've already committed to.
Including a calendar invite or link in your reminders makes it even easier for your audience to save the date. It’s a small step that shows you value their time—and it can significantly boost attendance.
Webinar Costs
The cost of running webinars will impact the ROI of your webinar strategy. So how much does it actually cost to run a webinar?
50. Hosting a webinar can cost between $0 and $5000+
(Contrast — 2025)
All the best webinar tools offer free plans allowing businesses to start getting registrations on their landing page and run a webinar for $0 (if they already have equipment like a laptop). Some businesses will want to invest in hiring guest speakers, paid marketing, or better equipment to improve their webinar strategy and this can increase costs significantly.
51. 6% use their phones as a camera during the webinar
(Contrast — 2025)
93% of webinars are run using a regular laptop webcam. As laptop camera quality continues to improve each year, businesses can create professional webinars without investing in expensive equipment. Meanwhile, 6% of webinars are conducted via smartphones, which now offer high-quality, hand-held camera images, and only 1% use professional camera setups.
52. The average cost per lead for webinars is $72
(VisitorQueue — 2023)
At $72 per lead on average (ranging from $45 to $98), webinars offer a cost-effective way to generate high-quality leads — especially when compared to paid ads or physical events. When you factor in the long-term value of those leads and all the other potential benefits from webinars: the content, engagement, SEO potential, webinars still have incredibly high ROI.
Webinar Repurposing Statistics
Webinar repurposing is the new trend in the webinar space, and is saving marketers a lot of time, but how efficient is repurposing?
53. 87% of B2B Marketers use AI for their webinars and virtual events
(ON24 – 2025)
AI has completely transformed webinars for B2B marketers, with 87% now using AI tools in their event strategies. It's easy to see why this trend is picking up steam. Generative AI has completely changed the game when it comes to content creation from virtual events. One webinar can now become weeks worth of content across multiple channels, all without manually transcribing, writing and editing.
54. Engagement with AI-generated written content increased by more than 7X
(ON24 – 2025)
AI isn't just a nice-to-have for webinars anymore – it's driving real results. B2B marketers using AI are 7X more likely to hit their goals, and the audience data backs this up with engagement on AI-generated written content jumping by more than 7X.
55. Marketers save 13,000 Hours and $650,000 using AI to repurpose webinars
(Contrast — 2025)
In 2024 Repurpose AI was used 5,328 times across 3,632 webinars to automatically generate blog posts, articles, and campaign materials directly from webinar transcripts.
While a webinar might reach 80 people live, the AI-generated clips, newsletters, and social content created from each session multiply that reach exponentially. Instead of spending 2.5 hours manually writing each blog post, marketers now redirect that time toward strategy and growth, with the webinar transcript serving as the complete brief for new campaigns.
It takes 2.5 hours to write a blog post from a webinar. Multiply that by 5,328 uses of Repurpose AI—and you’ve saved over 13,000 hours or roughly $650,000 in copywriting labor (at $50/hour).
56. Each webinar has potential to create 5 short clips on average
(Contrast — 2025)
AI analysis of hundreds of webinars have shown that the average webinar has 4 or 5 moments that could be made into clips with high virality scores: sharing personal experiences or anecdotes, numbers, stories or more.
Creating these clips is simple: you can highlight parts of the script yourself to cut into shorts, or let AI automatically select the most engaging moments. These clips can then be shared across social media, emails, and landing pages to keep your content working long after the webinar ends.


Repurpose your Webinars in Minutes
Start for free with up to 30 registrants. No credit card needed.
Start for freeConclusion
There we go, we've finished covering these 56 webinar statistics — you have everything you need to start or improve your webinar strategy.
The main lesson is that you need to adapt to your audience: When's the best day of the week for them? What time are they available? How can you create content that's beneficial for them?
The better you understand your audience, the better webinars you'll be able to create for them.
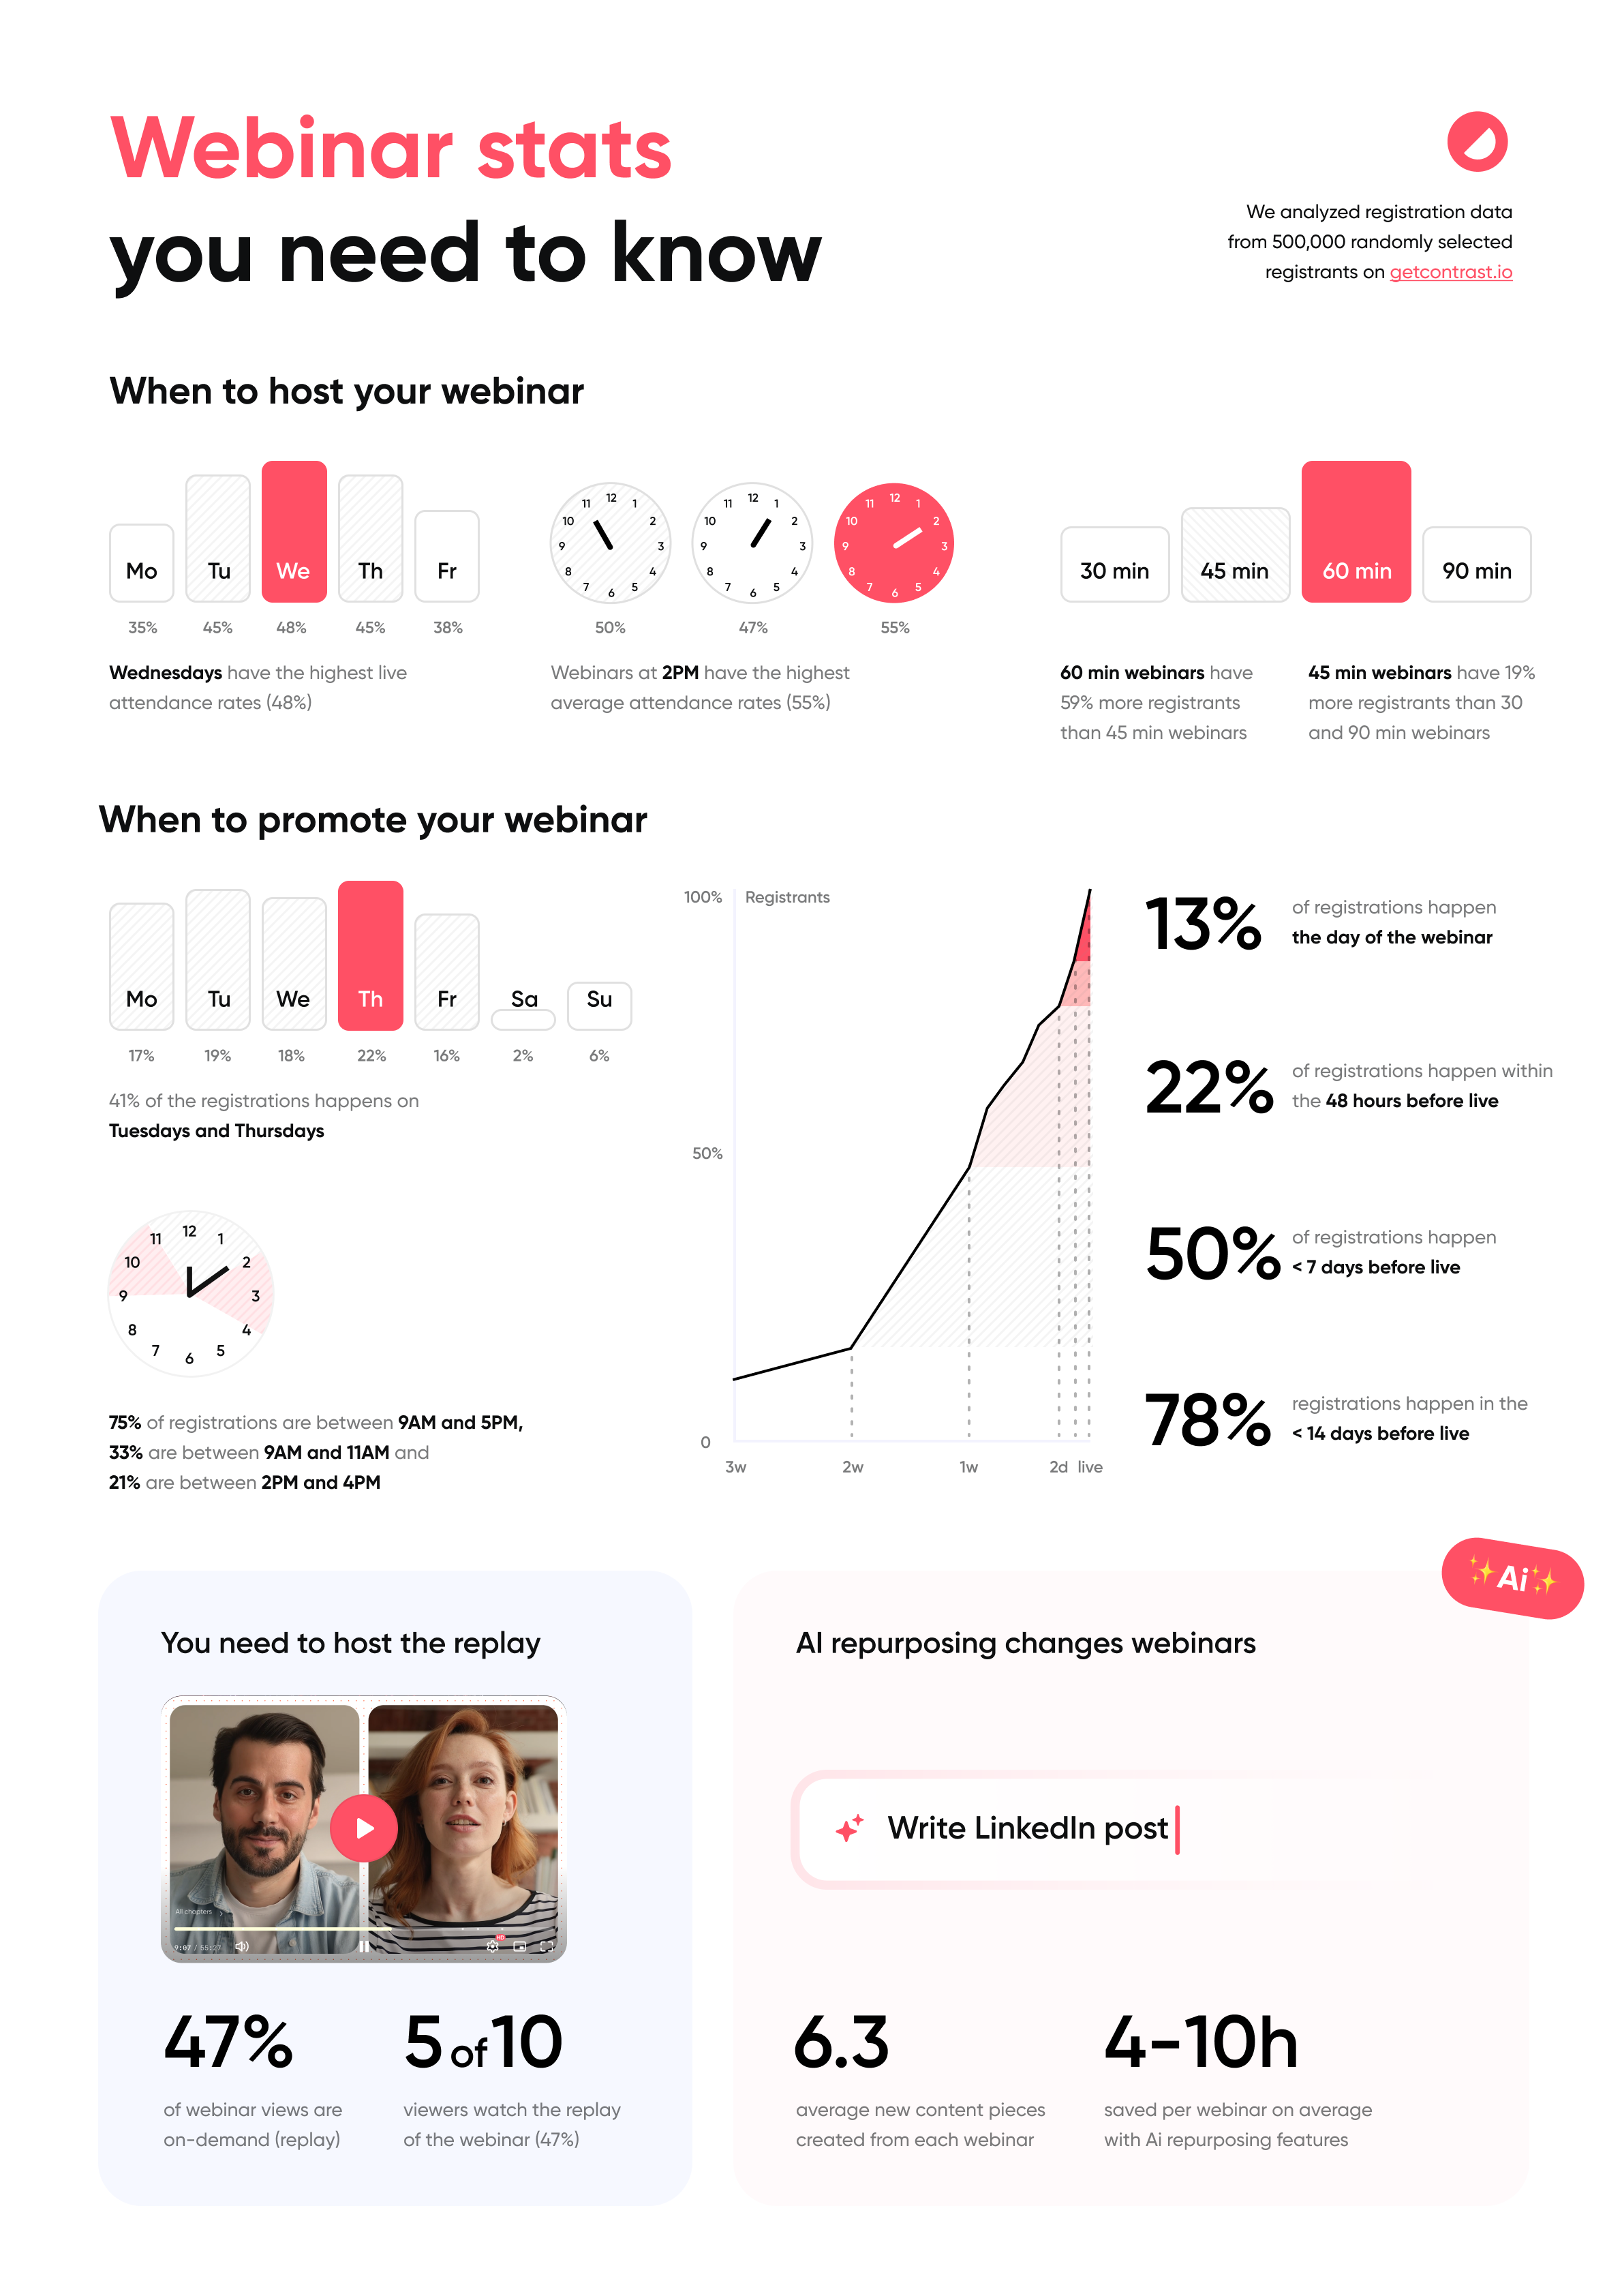
Save this cheat sheet so you can remember the key numbers:
Sources:
Contrast
Research Nester
BrightTALK
CustomMarketingInsights
Content Marketing Institute
Turelist
Frost & Sullivan
